









Transformer Export Growth Data: Why Demand Keeps Breaking Records
Nov 05, 2025
Leave a message
What the Customs Data Actually Shows
Published customs statistics put transformer export value in the first eight months of 2025 at about 29.7 billion yuan, a year-on-year increase of roughly 51 percent. August alone reached about 4.7 billion yuan, with growth accelerating to nearly 58 percent, and September exports of about 5.4 billion yuan were up roughly 60 percent year on year. Growth of that shape is not a single-month spike: three consecutive periods in which the growth rate rose rather than decayed is the signature of structural demand rather than a shipment timing effect.
For a buyer or a distributor, the practical reading is that lead times, not prices, are the binding constraint. When an order book grows faster than the installed capacity of winding, casting and test equipment, allocation is decided by delivery slot rather than by unit price.
Regional Demand Pattern
| Region | Export value, Jan to Aug | Year-on-year change |
|---|---|---|
| Europe | About 1.51 billion yuan | About +138 percent |
| Asia | About 2.03 billion yuan | About +65 percent |
| Africa | Not disclosed in the source table | About +28 percent |
| North America | Not disclosed in the source table | About -4 percent |
Europe is the outlier. Grid reinforcement programmes, the replacement of a fleet installed during earlier decades of demand growth and the connection queue for renewable projects have combined into simultaneous demand for distribution and substation transformers. Asia remains the largest volume market and continues to grow on the back of industrial electrification and network extension. Africa grows more slowly but steadily, driven by transmission and distribution build-out. North America, constrained by trade measures, moved slightly down, which reinforces the point that the growth is not uniform geography but concentrated where network investment is funded.
Why Transformer Demand Grows Faster Than Generation Capacity
The reason renewable energy drives transformer demand disproportionately is voltage conversion count. A large thermal plant concentrates its output on one or two main step-up transformers. A wind or photovoltaic plant of the same installed capacity distributes generation across hundreds of units, each needing its own step-up transformer and an additional collector-grid conversion step. Industry estimates place the transformer requirement of a renewable-dominated system at 1.5 to 3 times that of a thermal system of equal capacity, and the decentralised, intermittent output means more voltage levels, more protection devices and more redundancy.
Add three further drivers: replacement of ageing units, data centre and electrification load growth, and grid reinforcement required to connect new generation. All four pull on the same production base.
Supply Chain and Material Constraints
The two materials that set delivery time are grain-oriented silicon steel for the core and copper or aluminium conductor for the windings. Grain-oriented electrical steel is a specialised product with a limited number of qualified producers, and high-permeability grades with low specific loss are the first to be allocated when demand rises. Copper conductor for windings is normally specified as oxygen-free copper for high-voltage windings, and its price volatility feeds directly into the quoted load loss, because a supplier that reduces conductor section to save cost also increases load loss and running temperature.
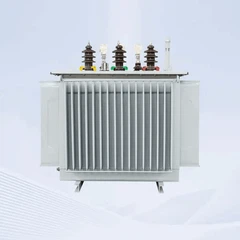
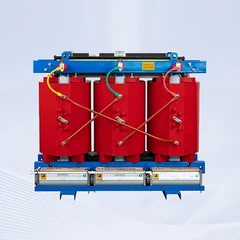
Insulating oil to IEC 60296 or ASTM D3487 and cast resin systems are the second constraint. Vacuum casting capacity for dry-type windings cannot be added quickly, which is one reason dry-type lead times widened before oil-immersed lead times did in the current cycle.
What Buyers Should Watch in the Coming Year
Verify loss figures rather than accept them: no-load and load loss must be quoted with a reference temperature and a test standard, typically IEC 60076-1 and IEC 60076-2 for liquid-immersed units and IEC 60076-11 for dry-type units. Check loss-class compliance for the destination market, since distribution transformer efficiency classes are regulated in several jurisdictions and a unit that meets a national specification may still fail the local minimum efficiency requirement. Finally, confirm that the offered delivery date is backed by material allocation, because a schedule issued before core steel is booked is not a schedule.
Frequently Asked Questions
Q: Is the export growth a one-off spike or a durable trend?
A: The growth rate rose across three consecutive periods rather than decaying, and it is supported by network investment and renewable connection queues, which suggests a multi-year trend.
Q: Why did Europe grow fastest in percentage terms?
A: Grid reinforcement, replacement of ageing units and renewable grid connection all landed in the same period, so the percentage change is measured from a smaller base.
Q: Why do renewable plants need more transformers per megawatt?
A: Output is distributed across many generating units and several voltage levels, so the same capacity requires 1.5 to 3 times the transformer steps of a thermal plant.
Q: Which design is affected most by the capacity bottleneck?
A: Large oil-immersed power transformers and cast-resin dry-type units, because both depend on specialised winding and vacuum casting capacity that cannot be added quickly.
Q: What should be verified in a quotation during a tight market?
A: Test standard, loss values with reference temperature, efficiency class for the destination market, and evidence of material allocation behind the delivery date.
Send Inquiry